Watching a run converge
A stochastic capital run folds thousands of scenarios over minutes. Until the last batch lands it is a black box: you cannot see whether the 95% CTE has settled, you cannot catch a run that will never converge, and you have nothing to show a reviewer watching over your shoulder. The estimate you actually care about — a tail reserve, a quantile, a mean — is sitting in the accumulator the whole time, but the loop only hands it back at the end.
for_each_scenario opens that accumulator up. Pass an on_batch callback and, after every batch folds, you receive a BatchSnapshot carrying the running partials — the same aggregates computed over every scenario seen so far. You read your tail metric off each snapshot and watch it drift toward its final value as the run streams, stop reporting once it has settled, or pipe each snapshot to a live chart.
Both entry points stream this way. for_each_scenario — the raw loop — takes on_batch directly. A reproducible ScenarioRun accepts the same on_batch and progress on its .run(...): watching a plan converge is a live observation channel and never changes its source_sha or audit sidecar. The portfolio folds that return a single summary — run_aggregated and run_to_parquet — hand back their results in one piece.
A convergence trace
A small book, 500 stochastic scenarios, each applying its own lognormal claim shock. The aggregator folds each scenario's portfolio net cashflow with .over("scenario_id"), so the running partial is the loss distribution built so far. The on_batch reads the 90% CTE off that distribution after every batch:
import random
import polars as pl
from gaspatchio_core import ActuarialFrame
from gaspatchio_core.scenarios import for_each_scenario, Sum

rng = random.Random(7)
book = pl.DataFrame({
    "policy_id": [1, 2, 3, 4, 5],
    "premium":   [1000.0] * 5,
    "claim":     [600.0] * 5,
})

n_scenarios = 500
scenario_ids = list(range(1, n_scenarios + 1))
# each scenario applies its own lognormal claim multiplier — a loss distribution
claim_shock = [rng.lognormvariate(0.0, 0.4) for _ in scenario_ids]


def model(af, *, tables=None, drivers=None):
    """The loop injects this batch's `scenario_id`; key the shock off it."""
    af.net_cf = pl.col("premium") - pl.col("claim") * pl.col("scenario_id").replace_strict(
        old=scenario_ids, new=claim_shock, return_dtype=pl.Float64
    )
    return af


def cte(dist: pl.DataFrame, level: float) -> float:
    """90% CTE of the loss: the mean of the worst (1 - level) of scenarios."""
    loss = -dist["portfolio_cf"]
    threshold = loss.quantile(level)
    return loss.filter(loss >= threshold).mean()


trace = []
def on_batch(snap):
    # snap.outputs["portfolio_cf"] is the running per-scenario distribution so far
    trace.append((snap.scenarios_done, cte(snap.outputs["portfolio_cf"], 0.90)))


result = for_each_scenario(
    ActuarialFrame(book),
    scenarios=scenario_ids,
    model_fn=model,
    aggregations=(Sum("net_cf").alias("portfolio_cf").over("scenario_id"),),
    batch_size=25,                       # explicit and small — see below
    on_batch=on_batch,
)

print("frames:", len(trace))
for done, c in trace[::3]:
    print(f"  after {done:3d} scenarios   running CTE90(loss) = {c:7.1f}")
print("final CTE90:", round(cte(result.aggregations["portfolio_cf"], 0.90), 1))
# frames: 20
#   after  25 scenarios   running CTE90(loss) =   -99.9
#   after 100 scenarios   running CTE90(loss) =   870.4
#   after 175 scenarios   running CTE90(loss) =  1209.1
#   after 250 scenarios   running CTE90(loss) =   986.0
#   after 325 scenarios   running CTE90(loss) =   917.3
#   after 400 scenarios   running CTE90(loss) =  1104.1
#   after 475 scenarios   running CTE90(loss) =  1175.1
# final CTE90: 1178.5
The shape is the point. At 25 scenarios the 90% CTE is meaningless — there are barely two scenarios in the tail. By a few hundred it has climbed into a tight band and, by the last batch, settled on 1178.5. You are reading the exact figure over the scenarios folded so far at each step, not an approximation: frame K is the true CTE of the first K batches.
What each snapshot carries
on_batch receives a frozen BatchSnapshot at the end of every batch:
| Field | Meaning |
|---|---|
batch_idx |
0-based batch index (the loop's enumerate index). |
scenarios_done |
Cumulative real scenarios folded so far, inclusive of this batch. Probe scenarios are never counted. |
total_scenarios |
Total scenarios in the run. |
outputs |
{alias: running partial} — the aggregate over every scenario seen so far. A scalar for a plain aggregator; a pl.DataFrame for one partitioned with .over(...). |
peak_rss_mb |
Peak resident memory at this point in the run, or None. |
elapsed_s |
Wall seconds since the run started, measured at the end of this batch. |
fraction_done |
scenarios_done / total_scenarios, in [0, 1] (0.0 for an empty run). |
eta_s |
Rough seconds remaining, by linear extrapolation from elapsed_s and fraction_done. None before any scenario folds; 0.0 once the run completes. |
throughput |
Real scenarios folded per second so far; None before any time has elapsed. |
elapsed_s is a stored field; fraction_done, eta_s and throughput are derived from it and the two counters — enough to drive a progress bar without touching the partials. Treat eta_s as a guide, not a clock: under batch_size="auto" the batches vary in size (and the search probes deliberately differ), so the estimate is approximate.
The values in outputs are materialised, not live accumulator state — a later batch never reaches back and mutates a snapshot you have already stored, so it is safe to keep every frame.
Sizing the batches so you can see it
To watch a metric converge, set an explicit small batch_size. The default batch_size="auto" sizes each batch to a memory budget, which on a small book folds the whole run in a handful of batches — a handful of snapshots, no visible convergence. batch_size=25 over 500 scenarios gives 20 frames; pick a size that trades frame count against the per-batch overhead you can afford.
Two more properties make the hook safe to wire into a long run:
- It cannot break the run. An exception raised inside your
on_batchis swallowed — the run completes and returns itsScenarioResultregardless. A broken dashboard never costs you a capital run. progress=Truegives you a default. Passingprogress=Truewithout your ownon_batchinstalls a built-in handler that logs each batch asscenarios {done}/{total} ({percent}) · ETA {time}— the ETA drops off the line once the run completes. If you pass both, youron_batchwins.
Streaming to a live view
Because every snapshot is the exact figure over the scenarios folded so far, the same hook drives a live dashboard. The pattern is deliberately plain — no framework, no socket:
- In
on_batch, append one JSON line per batch (your metric, plus a histogram of the running distribution) to a file, flushing after each write so a reader never sees a half-written record. - Serve the file and a small page next to it. The page polls the file every few hundred milliseconds and redraws a chart from the lines it has so far.
# docs-skip
import json

def on_batch(snap):
    dist = snap.outputs["portfolio_cf"]
    loss = -dist["portfolio_cf"]
    frame = {
        "scenarios_done": snap.scenarios_done,
        "total": snap.total_scenarios,
        "cte90": cte(dist, 0.90),
        "hist": loss.hist(bin_count=40)["count"].to_list(),
    }
    stream.write(json.dumps(frame) + "\n")
    stream.flush()   # so a polling reader never reads a torn line
A browser polling that file fills in the convergence trace and the loss histogram as the run streams — the left panel settling onto the final reserve, the right panel filling out the tail:
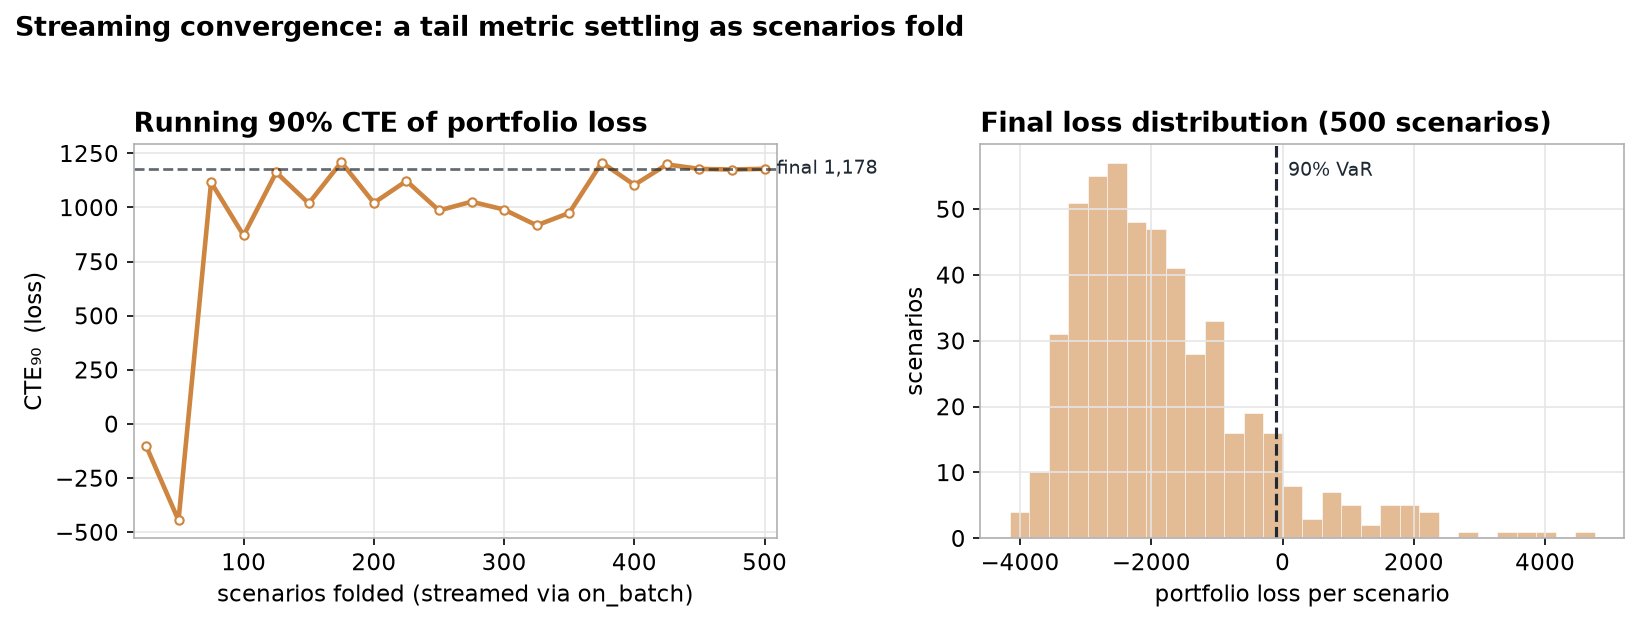
Two details keep the picture honest: freeze the histogram range on the first full batch (per-frame auto-ranging rescales the bars every tick), and keep the writer append-only with a flush per line so the polling reader always parses clean JSON. The Gaspatchio repository ships a worked example of exactly this — a convergence demo plus a dependency-free viewer — under evals/benchmarks/.
When to reach for on_batch
| You want... | Use |
|---|---|
| Watch a tail metric settle and stop once it has | for_each_scenario(..., on_batch=...), read the metric off each snapshot |
| A live convergence chart for a reviewer | on_batch appending JSONL frames, polled by a page |
| A progress log and nothing more | for_each_scenario(..., progress=True) |
| A progress log on a reproducible run | ScenarioRun.run(..., progress=True) |
| Watch a reproducible, hashable run converge | ScenarioRun.run(..., on_batch=...) |
| The final portfolio summary, memory-safe, no per-batch hook | run_aggregated |